A wild ride in UK power markets since the beginning of January.
Market Pulse

Both prompt markets and on the curve, we have seen real ups and down.
The prompt: unseasonably low wind and record spikes
Cold weather and low renewables have been driving the prompt markets.
Over the past few weeks we’ve seen a few instances where wind generation was <2 GW, almost 10 GW less than the usual seasonal average of 11 GW
This very low wind generation, coupled with shiveringly low temperatures, meant National Grid had to issue several margin notifications (Electricity Margin Notification 6th Jan, Electricity Capacity Market Notice 8th Jan). See our previous blog here highlighting the differences. These types of alerts are issued by to request more electricity supply over a certain period, due to a forecast shortage of supply.
Alongside tight supply/demand conditions we have seen exceptional circumstances materialise in the Day Ahead markets. There are two factors driving this:
- Tight market conditions
- Brexit and subsequent market decoupling
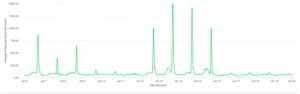
The chart above shows day ahead prices (APX) prices and we can see the prices spiked several times over the first 2 weeks. The spike on the 13th is a record level at £1499/MWh.
These high prices led to more inefficient (and hence more expensive) generators being called upon to provide MWs to the grid, less efficient MW have a higher short run marginal cost due to higher start-up and fuel costs.
Adding to volatile Day Ahead markets is the implications of Brexit. Brexit led to the decoupling of the EPEX and Nord Pool day-ahead auction platforms and mean they no longer clear together, hence they have different outturn prices. The market coupling algorithm, Euphemia, is no longer applicable to the UK which means Day Ahead prices here clear separately to European markets and the auctions run at different times. This is providing further complexity to an already complicated system!
The Curve: finely balanced Asian supply/demand impacts Europe
Below we chart the Feb-21 NBP gas contract (p/therm). Gas is a much more liquid product than power and is a key driver for UK power so is often a better proxy to gauge the state of the market.
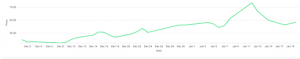
We can see prices increased substantially from Jan-6th – Jan-11th.
Why was this?
Over that time Asian LNG prices nearly doubled, trading up to $29/mmbtu due to exceptionally cold weather in East Asia increasing demand. This meant Asian supply/demand was very finely balanced.
This is very significant because LNG often provides a significant portion of European gas.
However, with the increase in Asian LNG prices, cargoes diverted from Europe to Asia to capitalise on the higher prices. This meant that for February prices had to rise to incentivise more expensively priced European gas storage to withdraw. This has a knock-on effect on the curve as it will mean gas storage needs to spend more time injecting to replenish stocks, so we also see the summer contract increase too. In recent days we have seen curve prices fall slightly, the key driver of this is weather forecasts suggesting higher renewable generation in the U.K. as well as temperatures in Asia returning to more normal levels.
This volatility on the curve and prompt market highlights a few things:
- How increasingly interconnected global gas (and power) markets have become
- The fact that with more renewable generation comes more volatility
- The significant role that flexible assets play towards supporting a transition to a low carbon grid
Our 24/7 trading desk has had a busy start to the year helping many of our renewable customers lock in high prices for their generation on the forward curve and also maximising value for our flexible assets amongst all of the prompt market volatility. To find out more about how we can support you in optimising your assets and capitalise on these trends. Get in touch for more information here.